Home > Animals > Insects > Hemiptera > Yellow Scale
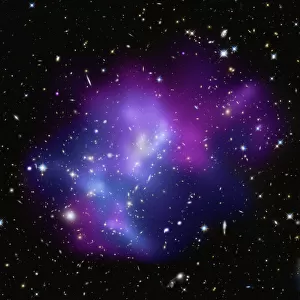
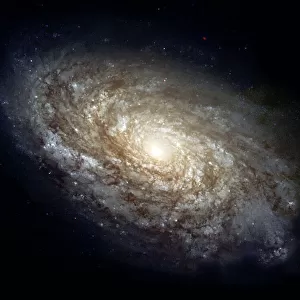
Diagram showing the spectral class and luminosity of stars

![]()
Wall Art and Photo Gifts from Stocktrek
Diagram showing the spectral class and luminosity of stars
Diagram showing the spectral class and luminosity of stars. The diagram was named The Hertzsprung-Russell Diagram, or the H-R diagram for short. At the beginning of the 20th century two astronomers found that if stars were plotted on a diagram with their luminosity (brightness) on one axis, and their spectral class on the other, that stars formed three distinct groups. The largest group, the Main Sequence Stars, is where 90% of the stars are found. These stars are fusing hydrogen into helium in their cores. This group propagates diagonally from the upper left corner, down to the right corner. The group below the main sequence is the White Dwarfs, which is a group of small, earth-sized stellar remnants. The third group, which is found above the main sequence is that of the giants.
Stars appear on a specific place on the main sequence depending on their mass and age. The mass determines when it will leave the main sequence.The H-R diagram is a significant tool for astronomers, when it comes to understanding stellar evolution
Stocktrek Images specializes in Astronomy, Dinosaurs, Medical, Military Forces, Ocean Life, & Sci-Fi
Media ID 13058701
© Fahad Sulehria/Stocktrek Images
Astrophysics Blue Chart Comparison Diagram Dwarf Stars Giant Stars Green Hydrogen Hypergiant Luminosity Main Sequence Stars Pattern Phase Remnants Representation Scale Sequence Size Spectrum Stellar Supergiants Temperature Text Variation White Dwarfs Yellow Axis Brightness Classification Evolution Fusion Graph Helium Magnitude Nuclear Fusion Plot Scatter Variable
FEATURES IN THESE COLLECTIONS
> Animals
> Fishes
> R
> Red Grouper
> Animals
> Insects
> Hemiptera
> Green Scale
> Animals
> Insects
> Hemiptera
> Yellow Scale
> Maps and Charts
> Related Images
EDITORS COMMENTS
This print showcases a remarkable diagram known as The Hertzsprung-Russell Diagram, or the H-R diagram for short. Created at the beginning of the 20th century by two visionary astronomers, this diagram revolutionized our understanding of stars. By plotting stars based on their luminosity and spectral class, three distinct groups emerged. The largest group, occupying a prominent position along a diagonal line from the upper left to the lower right corner, is called Main Sequence Stars. These magnificent celestial bodies make up an astounding 90% of all stars and are engaged in fusing hydrogen into helium within their cores. Beneath the main sequence lies another group known as White Dwarfs. These small remnants resemble Earth in size but possess extraordinary cosmic significance. Above the main sequence resides yet another awe-inspiring group: giants. These colossal stellar beings captivate us with their immense size and radiance. Stars find their place on the main sequence depending on both mass and age, with mass determining when they will eventually depart from this stage of stellar evolution. The H-R diagram stands as an invaluable tool for astronomers seeking to unravel the mysteries of our universe's past and future. Its profound insights into stellar evolution have propelled humanity's understanding of these celestial wonders to new heights.
MADE IN THE USA
Safe Shipping with 30 Day Money Back Guarantee
FREE PERSONALISATION*
We are proud to offer a range of customisation features including Personalised Captions, Color Filters and Picture Zoom Tools
SECURE PAYMENTS
We happily accept a wide range of payment options so you can pay for the things you need in the way that is most convenient for you
* Options may vary by product and licensing agreement. Zoomed Pictures can be adjusted in the Cart.